

You scored your organization on 60 statements and the dashboard gave you six numbers. Here are the gaps industry research says those numbers are most likely to expose, the statements to look at first, and what each gap means for your data team.
In July we released the free Enterprise Big Data Maturity Assessment. It is based on the Enterprise Big Data Framework developed by Jan-Willem Middelburg, Director at DASCIN, and it treats big data as a set of organizational capabilities rather than a single IT project. Sixty statements across six modules, each scored from 0 to 5, roll up into a module average and an overall maturity level.
A score is only useful if you know how to read it. This article explains what each module tends to reveal, why, and what to do about it. For each module we point to the specific statements in the workbook that carry the most signal, and to independent research that shows how common each gap is across the industry.
About the evidence
The figures in this article come from published third-party research by Gartner, Wavestone, DataCamp and YouGov, and the IAPP. They are not aggregated results from the DASCIN assessment. Statement numbers (for example M2 Q8) refer to the module sheets in the downloadable workbook.
Before you start
How to read your dashboard
The dashboard converts each module average into one of six levels from the Capability Maturity Model. The bands are not equal: the top two levels each cover only half a point, so moving from Defined to Controlled is a smaller numeric step than the ones before it, but usually the hardest step in practice.
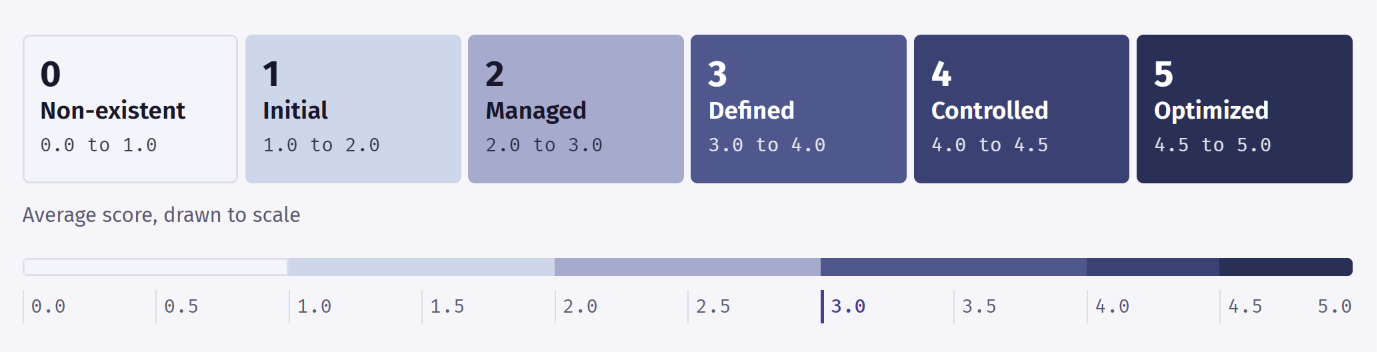
The dashboard converts each module average into one of six levels from the Capability Maturity Model. The bands are not equal: the top two levels each cover only half a point, so moving from Defined to Controlled is a smaller numeric step than the ones before it, but usually the hardest step in practice.
2018 to 2020
The compliance rush
Organizations focused on documentation: records of processing, privacy notices, consent mechanisms and DPO appointments. Governance lived in the legal department and was measured by checklists.
2020 to 2023
Transfers and record fines
The Schrems II ruling in July 2020 invalidated the EU-US Privacy Shield and forced companies to map every international data flow. Fines grew sharply, peaking with the €1.2 billion penalty against Meta in May 2023.
2024 to 2026
Convergence
The AI Act, the Data Act and the Data Governance Act turned privacy into one strand of a wider data governance discipline. The EU then moved to simplify the whole rulebook through the Digital Omnibus.
The findings
Six gaps the assessment is built to expose
One per module. For each, the evidence shows how widespread the gap is, the statements tell you where to look in your own results, and the last paragraph explains what it means for your team.
MODULE 01
Big Data Strategy
Investment runs ahead of strategy
Data and AI budgets have grown quickly, but the strategy that should direct them often lags. Organizations can buy platforms in a quarter. Agreeing on a roadmap, success measures and a funded operating budget takes much longer, and many skip it.
A typical pattern is a reasonable score for innovation (Q4, Q5) next to low scores for a documented roadmap (Q3) and measurable goals (Q7). Teams are experimenting, but nobody can say which experiments matter most.
For your data team
Without an agreed roadmap and targets, the team fields requests from every direction and struggles to show value. Push for a short, prioritized list of use cases with an owner and a success measure for each.
87.9%
of data leaders call investment in data and analytics a top priority, yet only 43% say they have established a data and analytics culture
Wavestone, 2024 Data and AI Leadership Executive Survey
Statements to check
M1 Q3 Big Data roadmap with documented use cases
M1 Q7 Clear goals and targets for success
M1 Q10 Annual budget approved by senior management
MODULE 02
Big Data Architecture
Data quality is the weak foundation
Architecture scores are often the highest of the six, because platforms, storage and security get budget and attention. The exception is usually data quality and master data. Validating data as it enters the platform and keeping one consistent version of core records are unglamorous jobs that rarely have a clear owner.
This matters more every year, because AI depends on it. Gartner predicts that through 2026, organizations will abandon 60% of AI projects that are not supported by AI-ready data. Poor data quality already costs organizations at least $12.9 million a year on average, according to Gartner research from 2020.
For your data team
A strong platform score with a weak score on Q8 or Q9 means you are storing data faster than you can trust it. Assign ownership for quality rules at ingestion and start a master data effort on the two or three entities the business uses most.
63%
of organizations do not have, or are unsure they have, the right data management practices for
AIGartner, February 2025
Statements to check
M2 Q8 Processes to validate quality of incoming data
M2 Q9 Master data management program
M2 Q1 Documented view of the full architecture
MODULE 03
Big Data Algorithms
Dashboards are strong, production models are not
Most organizations have built solid descriptive analysis: dashboards and reports that support management decisions (Q6, Q7). The scores tend to drop at the statements about running models over time: monitoring machine learning performance (Q9) and producing reproducible results (Q10).
Building a model is one thing. Keeping it accurate in production is another, and that is where many projects stall. Gartner found that on average only 48% of AI projects make it into production, and that the trip from prototype takes eight months.
For your data team
If Q9 and Q10 score well below Q6, invest in version control, experiment tracking and model monitoring before building more models. Our Knowledge Base entry What is MLOps? explains these practices.
48%
of AI projects make it into production on average, taking 8 months from prototype
Gartner survey, May 2024
Statements to check
M3 Q2 Version control for all algorithms
M3 Q9 Monitoring of active ML algorithms
M3 Q10 Reproducible results across stakeholders
MODULE 04
Big Data Processes
Governance exists on paper, not in practice
Many organizations can point to a data governance framework (Q1) and a set of policies for classification, privacy and retention (Q2). Fewer can say those policies are regularly monitored, assessed and improved (Q3), or that data quality is monitored automatically (Q5). The gap between those two pairs of scores is one of the most revealing numbers in the workbook.
Gartner predicts that by 2027, 80% of data and analytics governance initiatives will fail, and advises leaders to stop using a command-and-control approach and to tie governance to tangible business outcomes instead.
For your data team
If Q1 is high and Q3 is low, your framework is a document rather than a working process. Pick one business outcome that governance can visibly improve, such as faster regulatory reporting, and measure it. Check vendor management too (Q9, Q10); third-party data is often the least governed data in the organization.
80%
of data and analytics governance initiatives will fail by 2027, Gartner predicts, without a real or manufactured crisis
Gartner prediction, February 2024
Statements to check
M4 Q1 Governance framework based on standards
M4 Q3 Framework regularly monitored and improved
M4 Q5 Automatic, continuous quality monitoring
MODULE 05
Big Data Functions
Skills and data literacy are the bottleneck
This module asks about people rather than technology: knowledge management, critical skills, gap analysis, training and data literacy. It is the module most likely to surprise leadership, because technology investment does not raise it.
The research is consistent. In a DataCamp and YouGov survey of 517 US and UK business leaders published in February 2026, 60% reported AI skill gaps, fewer than half said their organization provides basic data or AI literacy training, and organizations with mature upskilling programs were twice as likely to report significant positive ROI from AI (42% against 21% overall).
For your data team
A low score on Q5 (skills gap analysis) means you cannot plan hiring or training with any confidence. Run a skills inventory against the roles your roadmap needs, then build a data literacy program for the wider business (Q8, Q9) so the team is not the only group that can read the data.
1 in 3
leaders report mature, organization-wide data and AI upskilling programs
DataCamp and YouGov, February 2026
Statements to check
M5 Q4 Critical skills defined for the BDCoE
M5 Q5 Periodic skills gap analysis
M5 Q8 Formal data literacy program
MODULE 06
Artificial Intelligence
AI ambition outpaces AI ethics
The final module covers deep learning, reasoning systems and knowledge representation, and ends with three statements on AI ethics: a policy (Q8), a framework (Q9) and a review process that tests products against ethical guidelines (Q10). Expect to see a staircase going down: a policy is quick to write, a working review process much less so.
Most organizations are now working on AI governance; the IAPP reported in 2025 that 77% are. Far fewer believe the job is done: in Wavestone’s 2024 survey, only 15.9% of data leaders said the industry has done enough to address data and AI ethics. In the EU, obligations for stand-alone high-risk AI systems apply from 2 December 2027, so Q10 is quickly becoming a compliance question as well as an ethical one.
For your data team
If Q8 scores higher than Q10, turn the policy into a checklist used at a defined point in every AI project, with someone accountable for sign-off. Start with the systems that make decisions about people.
15.9%
of data leaders believe the industry has done enough to address data and AI ethics
Wavestone, 2024 survey
Statements to check
M6 Q8 AI ethics policy
M6 Q9 AI ethics framework
M6 Q10 Ethics review process for AI products
Beyond single scores
Read the shape of your profile
The overall score hides as much as it shows. Two organizations at 2.5 can have very different problems. Plot your six module averages side by side and compare the shape with these three common patterns. The dashed line marks 3.0.
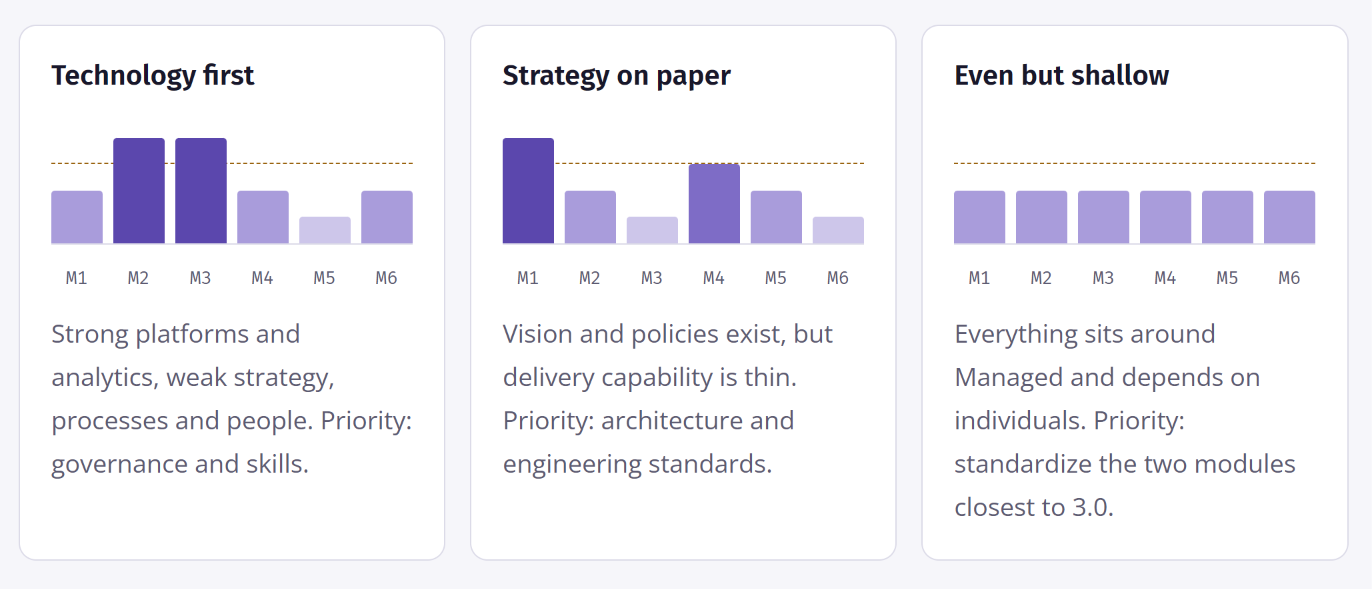
Illustrative profiles for interpretation, not measured results.
What to do next
Turning a score into a plan
- 1
Score it as a group, not alone
Ask several people from different functions to complete the workbook independently. The instructions ask for a view of the whole organization, and the differences between respondents are often more revealing than the averages.
- 2
Find the gaps inside each module
Compare the paired statements highlighted above. A large gap between “we have it” and “we review and improve it” points to the exact process that needs work.
- 3
Start with the lowest module
Your weakest capability usually limits the value of the strongest. Pick one improvement in that module you can deliver in a quarter.
- 4
Set a target level for each module
Not every module needs to reach Optimized. Agree a realistic 12 month target, such as moving from Managed to Defined, and link it to a business outcome.
- 5
Retake it in 6 to 12 months
The questions and scale stay the same, so a second round shows whether your investments are moving the numbers.
The assessment does not tell you how good your data team is. It tells you how much of your capability would survive if your best people left.
Common questions
References
- DASCIN, How Mature Is Your Organization’s Big Data Capability? (July 2026) and the Enterprise Big Data Maturity Assessment workbook
- Middelburg, J.W. The Enterprise Big Data Framework: Building Critical Capabilities to Win in the Data Economy
- Wavestone, The 12th Annual Survey of Fortune 1000 and Global Data and AI Leadership (2024)
- BigDATAwire, Wavestone Survey Shows GenAI Is Having a Major Impact on Data Culture (February 2024)
- Gartner, Lack of AI-Ready Data Puts AI Projects at Risk (February 26, 2025)
- Gartner, Data Quality: Why It Matters and How to Achieve It
- Gartner, Gartner Survey Finds Generative AI Is Now the Most Frequently Deployed AI Solution in Organizations (May 7, 2024)
- Gartner, Gartner Predicts 80% of D&A Governance Initiatives Will Fail by 2027 (February 28, 2024)
- DataCamp and YouGov, via Business Wire, Companies Are Investing in AI, But Their Workforces Aren’t Ready (February 26, 2026)
- IAPP, At a Glance: AI Governance Profession Report 2025 (May 2025)
- Regulation (EU) 2024/1689 (Artificial Intelligence Act), as amended by the AI Omnibus (2026)
Statistics are drawn from the third-party sources listed above and describe the wider market, not DASCIN assessment respondents. Predictions are labeled as such. This article is for general information.

